[vc_row][vc_column][crocal_video video_link=”https://www.youtube.com/watch?v=o9bpxFmOV0s” el_class=”kg-yt-video”][crocal_empty_space][vc_custom_heading text=”CTV Industry Trends” font_container=”tag:h2|font_size:26PX|text_align:left|color:%23000000″ google_fonts=”font_family:Roboto%3A100%2C100italic%2C300%2C300italic%2Cregular%2Citalic%2C500%2C500italic%2C700%2C700italic%2C900%2C900italic|font_style:400%20regular%3A400%3Anormal”][vc_column_text]We get asked a lot, “What’s the impact of the COVID-19 lockdown and the country reopening?”.
In Q2 2020 versus Q2 2021, a lot of talk in the Connected TV advertising space was on cord-cutters. However, at Keynes, we don’t talk about these users. Why? Because they only make up about 4% of total Connected TV advertising viewers. Instead, what Keynes looks at are stackers, or the total number of subscriptions held by a single household.

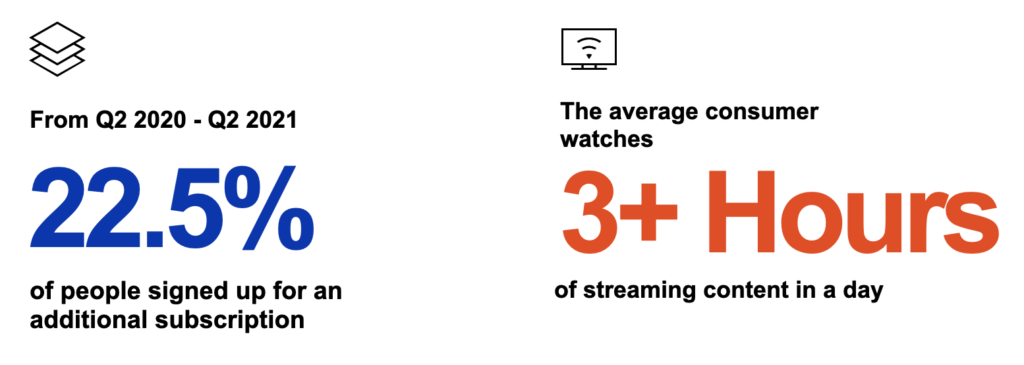
From Q2 2020 to Q2 2021, there has been a 22.5% increase in subscriptions per household. On top of this, there are various streaming platforms growing tremendously. Companies like HBO Max, Peacock, and Hulu all offer an ad-supported and ad-free version. Users have the option to pay more money to receive no TV commercials or pay a little less to receive TV commercials.
TV is a medium that has always run ads and people are accepting the transaction that they are going to receive ads to view content. Conversely, with the iOS 14.5 update and Chrome going cookieless in 2023, these transactions on mobile, desktops, and tablets are changing immensely and people are becoming wary about ad fraud with the data that’s being split and sold.
With Connected TV advertising, the industry is seeing consumers accepting that if they pay a little less, they’re going to receive ads and their data will be transacted on the backend. Consumers are choosing to receive TV commercials.
From Q2 2020 to Q2 2021, we’ve also seen over 3 hours of streaming content being consumed a day that stayed flat, or almost flat. This means we’re seeing people consuming just as much content as they did at the start of Covid-related shutdowns, but with more options and more choices of digital-only content that’s being produced.[/vc_column_text][crocal_empty_space][vc_custom_heading text=”Channel Comparisons” font_container=”tag:h2|font_size:26PX|text_align:left|color:%23000000″ google_fonts=”font_family:Roboto%3A100%2C100italic%2C300%2C300italic%2Cregular%2Citalic%2C500%2C500italic%2C700%2C700italic%2C900%2C900italic|font_style:400%20regular%3A400%3Anormal”][vc_column_text]The ad tech industry spends a significant portion of its time talking about one channel versus the other. With any brand, there are various ways of finding a consumer. Connected TV advertising isn’t better than YouTube or Facebook. It’s just all part of the marketing mix, yet Keynes’ stance says that Connected TV advertising finds different users.
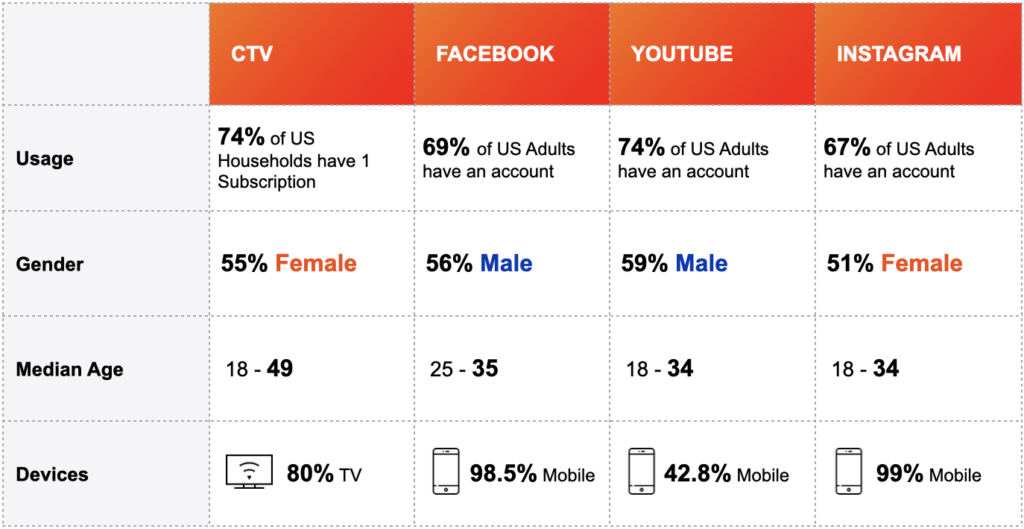
Connected TV advertising reaches 74% of households in the US compared to Facebook, which reaches 69% of US adults. Youtube is about the same reach as Connected TV advertising sitting at 74%, and Instagram sits at about 67%.

The interesting part of this chart is the devices that people are using to access these channels. Facebook recorded 98.5% of content consumed on mobile which is being heavily impacted by iOS 14.5. Instagram saw close to 100% of content consumed on mobile, and YouTube saw 42.8% on mobile and 30% on a TV screen.
As for Connected TV devices or OTT devices, 80% of streaming content is being watched on a TV screen, with less consumption on other devices at 9% on mobile, 9% on PCs, and 2% on tablets.
This means if brands are being affected by iOS 14.5 and not seeing the performance numbers they once were, Connected TV advertising is a choice to incorporate into their marketing efforts to reach more users outside of their mobile device. As mentioned, 9% of the content is being consumed on mobile which results in around 4.5% being on iOS 14.5 devices. The only channel not seeing this huge impact is Connected TV advertising. So, now it’s a question of how this impacts the overall marketing mix and how we get people on other devices where they’re consuming content differently.[/vc_column_text][crocal_empty_space][vc_custom_heading text=”Subscriptions by Household” font_container=”tag:h2|font_size:26PX|text_align:left|color:%23000000″ google_fonts=”font_family:Roboto%3A100%2C100italic%2C300%2C300italic%2Cregular%2Citalic%2C500%2C500italic%2C700%2C700italic%2C900%2C900italic|font_style:400%20regular%3A400%3Anormal”][vc_column_text]
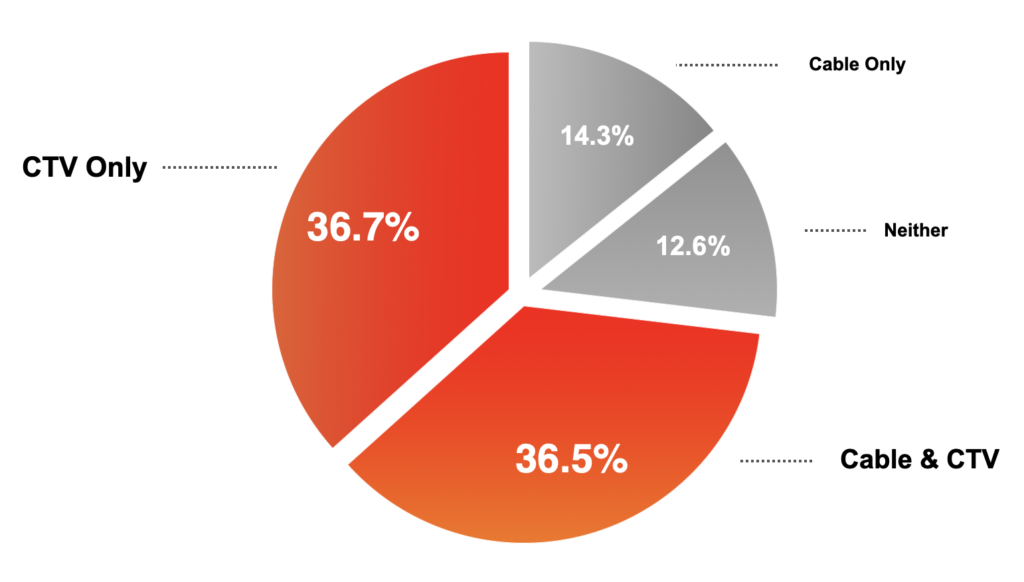
A key reason we don’t talk about cord-cutters is that Connected TV advertising has already surpassed Linear TV. Approximately 74% of households use a Connected TV device, with some having both Cable and Connected TV subscriptions. Yet over 36% use Connected TV subscriptions only. This is double the amount of people that use cable TV only.
If a brand’s goal is to connect with large parts of the country, the data tells us that a big slice of the pie is found on Connected TV advertising.[/vc_column_text][/vc_column][/vc_row]
